
Registration Open
California Housing Price Prediction Pipeline - Week of 16 Nov 2026
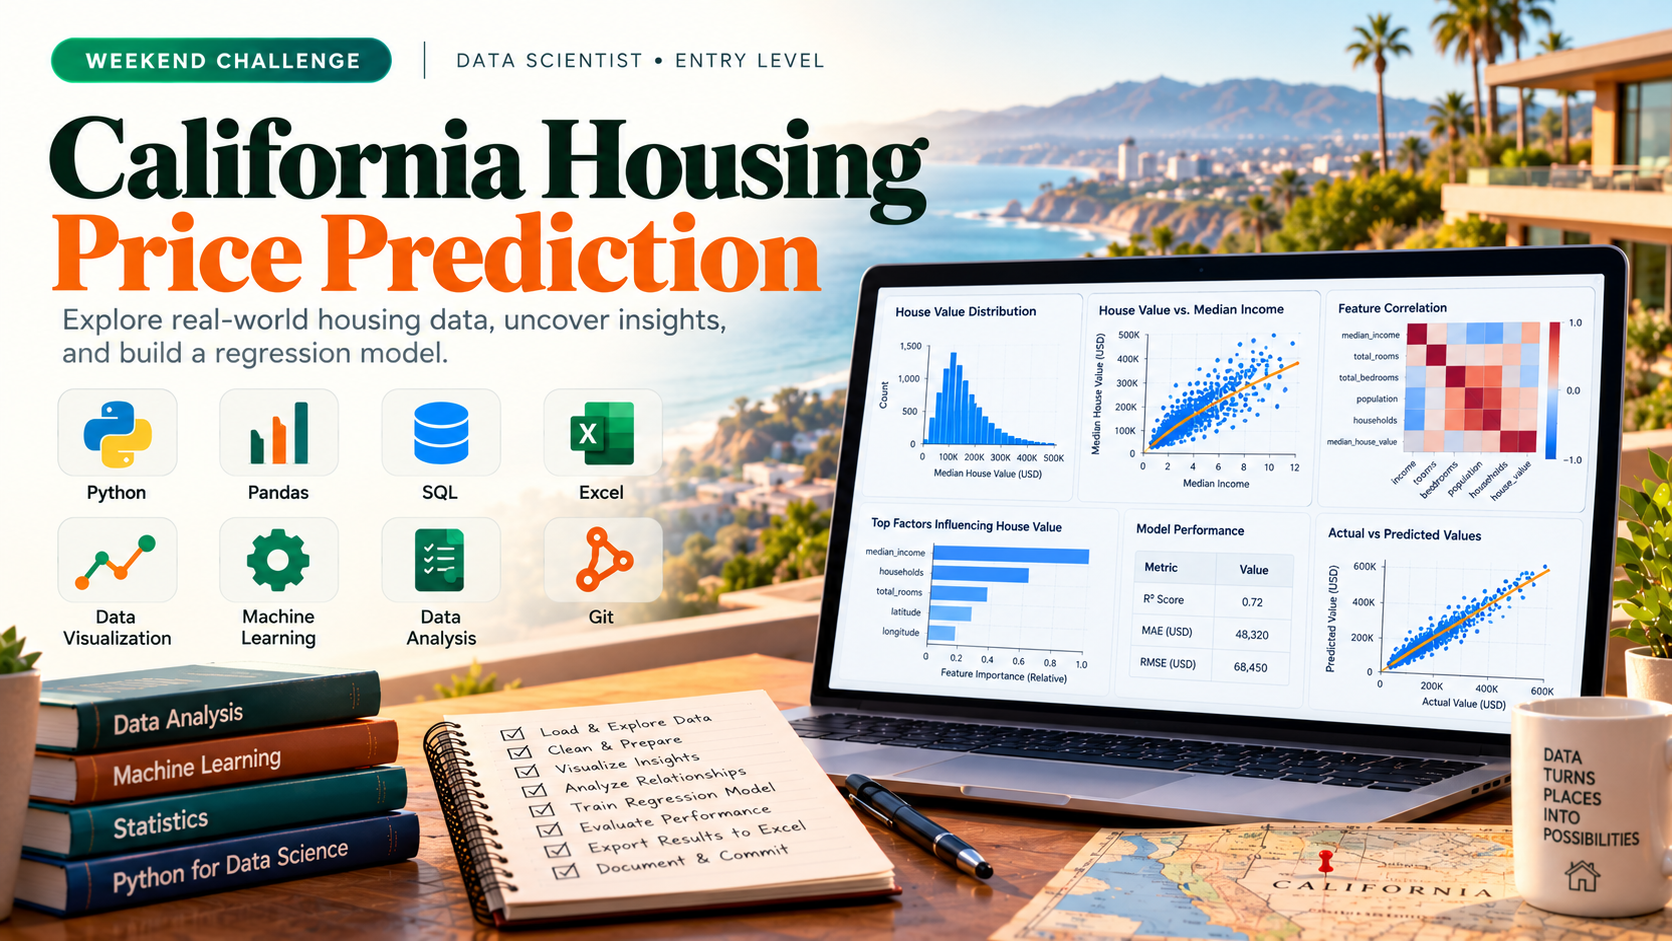
Build a Python data analysis and prediction pipeline using the California housing dataset to clean, explore, and model median house values. You will use Pandas, SQL queries, statistical analysis, and visualization to prepare data and train a regression model, with version control and AI-assisted development throughout.
Data Analyst
Solo only.
Share this challenge
The Challenge Brief
Problem definition
Input data (download): https://raw.githubusercontent.com/ageron/handson-ml/master/datasets/housing/housing.csv
This dataset contains 20,640 records of California housing with features including longitude, latitude, housing_median_age, total_rooms, total_bedrooms, population, households, median_income, and median_house_value. You will ingest this CSV, clean missing and duplicate records, perform exploratory analysis to understand distributions and correlations, and build a linear regression model to predict median_house_value from the available features. The pipeline must validate data quality, handle outliers, and produce reproducible results with clear documentation. Every line under Success criteria is in scope for this challenge. Build the core scope in Task brief. Topic coverage uses repository evidence where available and the comprehension conversation; it does not require a separate feature for every topic.
Task brief
You will implement a complete data pipeline in Python that demonstrates Version Control, SQL, Programming Fundamentals, Python Programming, Pandas, Excel, Data Cleaning & Preparation, Exploratory Data Analysis, Statistical Fundamentals, Data Visualization, and AI Assisted Software Development. The pipeline must: (1) load and inspect the housing CSV; (2) clean data by handling missing values, duplicates, and outliers; (3) perform exploratory analysis with summary statistics and correlation analysis; (4) create at least three visualizations (histograms, scatter plots, or heatmaps); (5) query and filter data using Pandas operations equivalent to SQL WHERE and GROUP BY; (6) train a linear regression model and evaluate it with train/test split and metrics (R-squared, MAE); (7) export cleaned data and results to Excel; (8) version control all work with meaningful commits. Estimated effort: 6-8 hours with AI assistance. You may use AI tools to scaffold code, but you must understand, test, and adapt every component.
Version Control
Initialize and maintain a Git repository for the housing analysis pipeline, committing data ingestion, cleaning, exploratory analysis, and regression model code with clear messages. Use branching to isolate feature work, merge changes back to main, and resolve conflicts when teammates update the same files. Version Control ensures the team can review code changes, rerun the analysis on updated data, and track the evolution of the pipeline from raw CSV to final predictions.
SQL
SQL is used in this project to ingest, clean, and query the California housing dataset stored in a relational database. You will write SELECT queries with WHERE, GROUP BY, and aggregate functions to validate data quality, identify missing or duplicate records, and compute summary statistics for exploratory analysis. These queries support the data preparation phase before model training.
Programming Fundamentals
Programming Fundamentals underpins the entire California housing analysis pipeline. You will use variables and data types to store dataset records, operators and expressions to compute statistics and model predictions, control flow to validate data quality and handle missing values, functions to modularize data loading and cleaning steps, collections to organize features and results, exception handling to manage file and parsing errors, and file handling to ingest and persist the CSV dataset. These core language skills enable you to build a reproducible, maintainable analysis workflow.
Python Programming
Build a reproducible Python data pipeline to ingest, clean, and analyze the California housing CSV, then train a linear regression model to predict median house values. Use Python syntax, functions, and standard libraries (pandas, scikit-learn, matplotlib) organized in modules within a virtual environment to ensure teammates can review and rerun the analysis.
Pandas
Use Pandas to ingest the California housing CSV, construct Series and DataFrames to represent the dataset, filter records to remove missing values and duplicates, and apply groupBy operations to compute summary statistics by geographic region. This work forms the data preparation and exploratory analysis foundation for the regression pipeline.
Excel
Use Excel to ingest the California housing CSV, create pivot tables to summarize median house values by geographic regions and housing age bands, and apply lookup functions to cross-reference feature statistics during exploratory analysis. This skill supports the data analyst role in preparing clean, summarized data views for the regression pipeline and market report.
Data Cleaning & Preparation
Ingest the California housing CSV, clean missing values and duplicates, detect and handle outliers, and prepare a validated dataset for exploratory analysis and regression modeling. Data Cleaning & Preparation is the foundation for reliable downstream analysis and model performance in this real estate analytics pipeline.
Exploratory Data Analysis
Perform Exploratory Data Analysis on the California housing dataset to understand feature distributions, identify missing values and duplicates, and quantify relationships between predictors and median house value. This skill underpins data quality validation and feature selection for the regression pipeline.
Statistical Fundamentals
Apply Descriptive Statistics to summarize and understand the California housing dataset during exploratory analysis. Calculate and interpret key statistics—mean, median, standard deviation, quartiles, and distributions—for housing features and the target variable (median_house_value) to inform data quality checks, identify outliers, and guide feature selection for the regression model.
Data Visualization
Create exploratory data visualizations for the California housing dataset to communicate distributions, correlations, and outliers to stakeholders. Use Python visualization libraries to generate publication-ready charts that support the regression analysis pipeline and inform the market report. Data Visualization enables the team to identify patterns and validate data quality before modeling.
Ai Assisted Software Development
Use AI assistants to accelerate development of the California housing analysis pipeline: code generation for data ingestion and model building, debugging of data quality issues, refactoring for clarity and reusability, and test generation for validation. Validate AI outputs against the core requirements and document your reasoning for key decisions to build proficiency in AI-assisted software development.
Language and stack
Python 3, Pandas, scikit-learn, Matplotlib or Seaborn, pytest, Git, and Excel export via openpyxl or pandas.ExcelWriter.
Scenario
You are a junior data analyst at a real estate analytics firm. The team needs a reproducible pipeline to analyze California housing trends and predict property values for a market report due in one day. Your manager has provided the raw CSV and expects a clean dataset, summary statistics, visualizations, and a baseline regression model. The pipeline must be version-controlled so teammates can review your work and rerun analysis on updated data.
Deliverables
- Python package with modules for data loading, cleaning, EDA, modeling, and visualization. Include a main script that runs the full pipeline end-to-end.
- Pytest test suite covering data validation, cleaning logic, and model output shape and type.
- Cleaned dataset and model results exported to Excel (one sheet for cleaned data, one for summary statistics and model metrics).
Success criteria
These are repository evidence checks within the core scope, not additional feature requests. One implementation or test may provide evidence for several topics. Missing implementation evidence remains unverified; explanations alone do not demonstrate implementation proficiency.
Version Control
- Repository Setup (beginner): Git repository initialized in the project root with a .gitignore file excluding data artifacts, model outputs, and Python cache; initial commit present.
- Basic Commands (beginner): At least three commits with distinct, descriptive messages covering data loading, cleaning, and model training phases; git log shows commit history.
- Commits (beginner): Each commit is atomic, addressing one logical step (e.g., data ingestion OR exploratory analysis OR model fit); commit messages follow a consistent format.
- Branching (beginner): At least one feature branch created, used to develop a specific component (e.g., data-cleaning or model-training), and merged back to main; branch history visible in git log or git branch output.
- Merging (beginner): Feature branch successfully merged to main without manual conflict resolution required, or if conflicts occur, they are resolved and the merge is completed.
- Conflict Resolution (intermediate): If two branches modify the same file (e.g., data preprocessing or model parameters), conflicts are identified, resolved with correct logic preserved, and the merge is completed; resolution reasoning is documented in commit message or code comments.
- Pull Requests (intermediate): If evidence is present, a pull request or equivalent code review artifact shows the learner requesting review of a feature branch, with at least one comment addressing feedback or explaining changes; assess only if present in the repository.
SQL
- SELECT Queries (beginner): Write and execute a SELECT query that retrieves all records or a filtered subset from the housing table; verify correct column selection and row count in query output.
- JOINs (intermediate): If the core pipeline loads housing data into multiple related tables (e.g., location and property features), write an INNER or LEFT JOIN query that combines them; verify joined result contains expected columns and row counts match the join logic.
- GROUP BY (intermediate): Write a GROUP BY query with an aggregate function (COUNT, SUM, or AVG) to compute summary statistics by region or age bracket; verify grouped output is correct and used in exploratory analysis or validation.
- SELECT, FROM, WHERE (intermediate): inspect relevant code or tests within the core scope if present; do not add a feature solely for this topic. Missing implementation evidence remains unverified.
- GROUP BY, ORDER BY (intermediate): inspect relevant code or tests within the core scope if present; do not add a feature solely for this topic. Missing implementation evidence remains unverified.
- Join S (INNER, LEFT) (intermediate): inspect relevant code or tests within the core scope if present; do not add a feature solely for this topic. Missing implementation evidence remains unverified.
- Aggregate Functions (COUNT, SUM, AVG) (intermediate): inspect relevant code or tests within the core scope if present; do not add a feature solely for this topic. Missing implementation evidence remains unverified.
- Subqueries (beginner): If present in the core pipeline, write a subquery to filter or rank records (e.g., find records where median_income exceeds the dataset average); verify subquery executes without error and produces correct filtered results.
- Basic DDL/DML (beginner): If the pipeline includes table creation or data insertion, write CREATE TABLE or INSERT statements to set up the housing table; verify table schema matches the CSV structure and data loads without errors.
Programming Fundamentals
- Variables & Data Types (beginner): Dataset loaded into a pandas DataFrame or equivalent structure with correct column types (numeric for housing features, object for categorical if present); evidence in core data loading code.
- Operators (beginner): Arithmetic or comparison operators used in feature scaling, filtering outliers, or computing derived statistics (e.g., rooms per household); observable in analysis or model preparation code.
- Expressions (beginner): Conditional or arithmetic expressions used to identify and flag missing or duplicate records; evidence in data cleaning logic.
- Control Flow (beginner): If/elif/else or loop constructs used to iterate over records, validate thresholds, or branch on data quality checks; observable in cleaning or validation code.
- Functions & Methods (beginner): Custom function or reusable method defined to encapsulate data loading, cleaning, or feature engineering; called at least once in the pipeline.
- Collections (intermediate): Lists, dictionaries, or pandas Series/DataFrames used to store multiple features, results, or validation flags; evidence in data organization and model feature handling.
- Exception Handling (intermediate): Try/except block present to catch file not found, parsing errors, or missing value exceptions during CSV ingestion or data processing; observable in file handling or cleaning code.
- File Handling (beginner): CSV file read from the provided URL or local path using open(), pandas.read_csv(), or equivalent; write cleaned dataset or results to a new file; both operations observable in the pipeline.
Python Programming
- Python Syntax (beginner): CSV ingestion, data cleaning (missing/duplicate removal), and summary statistics computed using pandas in the main script or notebook.
- Functions (beginner): At least one reusable function (e.g., load_data, clean_data, or compute_stats) called within the pipeline; function must accept parameters and return values.
- Modules & Packages (beginner): Code organized into separate .py files (e.g., data_loader.py, model.py) and imported in a main script; external packages (pandas, scikit-learn, matplotlib) installed and used.
- Virtual Environments (beginner): requirements.txt or pyproject.toml present in the repository; evidence that dependencies are pinned and reproducible across runs.
- Object-Oriented Python (intermediate): At least one class (e.g., HousingAnalyzer or RegressionModel) with methods for data processing, model training, or prediction; class instantiation and method calls visible in the pipeline.
Pandas
- Series & DataFrames (beginner): Repository contains code that reads the housing CSV into a DataFrame, accesses at least one Series by column name, and displays shape or info to confirm successful ingestion.
- Filtering (intermediate): Repository shows filtering logic that removes rows with missing total_bedrooms values and duplicate records, with the cleaned DataFrame persisted or logged.
- GroupBy (intermediate): Repository includes groupBy operation grouping by latitude or longitude bins (or similar geographic proxy) to compute mean median_house_value or median_income per group, with results displayed or stored.
Excel
- Pivot Tables (intermediate): Learner repo contains a working pivot table (or equivalent groupby aggregation in Python pandas exported to Excel or demonstrated in notebook) that groups housing records by latitude/longitude bins and housing_median_age ranges, computing mean and count of median_house_value; verify the pivot correctly summarizes at least two dimensions and produces accurate aggregate values matching manual spot-checks.
- Lookup Functions (intermediate): Learner repo contains evidence of a lookup operation (VLOOKUP, INDEX/MATCH in Excel, or pandas merge/join in Python) that cross-references feature statistics (e.g., mean total_rooms or median_income by region) back to the main dataset; verify the lookup returns correct values for at least three test cases and handles missing keys gracefully.
Data Cleaning & Preparation
- Missing Values (intermediate): Repository contains code that identifies missing values in the dataset (e.g., using pandas isnull() or similar), documents the count and columns affected, and applies a documented strategy (removal, imputation, or flagging) with justification logged in the pipeline.
- Outlier Detection (intermediate): Repository contains code that detects outliers using a defined method (e.g., IQR, z-score, or domain thresholds), visualizes or reports outlier records, and applies a handling strategy (removal, capping, or flagging) with reasoning documented in comments or a data quality report.
Exploratory Data Analysis
- Data Profiling (intermediate): Load the housing CSV, compute summary statistics (mean, median, std, min, max, quartiles) for all numeric features, identify and report missing values and duplicate rows, and document data shape and dtypes in a reproducible script or notebook.
- Correlation Analysis (intermediate): Calculate the correlation matrix for all numeric features, identify the top 3-5 features most correlated with median_house_value, and visualize correlations using a heatmap or scatter plots to justify feature selection for the model.
Statistical Fundamentals
- Descriptive Statistics (intermediate): Repository contains working code that computes and displays summary statistics (mean, median, std, min, max, quartiles) for at least the key numeric features and median_house_value; output is visible in a notebook cell, script output, or test assertion showing correct numeric values and reasonable interpretation of spread and central tendency.
Data Visualization
- Power BI Fundamentals (intermediate): if Power BI artifacts are present in the repository, verify that at least one dashboard or report connects to the housing dataset and displays key metrics (e.g., median house value by region, income distribution) with appropriate chart types and filtering; assess only if present, do not require Power BI extension.
- Tableau Fundamentals (intermediate): if Tableau workbooks are present in the repository, verify that at least one sheet visualizes housing data with interactive elements (e.g., geographic scatter plot, correlation heatmap, or price distribution) and demonstrates correct data binding; assess only if present, do not require Tableau extension.
Ai Assisted Software Development
- Working with AI Assistants (beginner): Repository contains evidence of AI tool usage in commits or code comments (e.g., prompt snippets, tool attribution, or iterative refinement notes) for at least two pipeline stages.
- Prompt Writing Fundamentals (beginner): Commit history or inline comments show at least one refined prompt that improved code quality or correctness compared to an initial attempt.
- Code Generation (beginner): Core pipeline functions (data loading, cleaning, model training) are present and functional; evidence of AI generation is documented in commit messages or code comments.
- AI-assisted Debugging (beginner): Repository shows a bug fix or data quality issue resolved with AI assistance documented in commit message or code trace.
- AI-assisted Refactoring (intermediate): Refactored code section (e.g., repeated logic consolidated, function extracted) with explanation in commit message of why the change improves maintainability or performance.
- AI-assisted Unit Testing (intermediate): Test file contains at least three pytest test cases generated or refined with AI assistance; tests pass and cover data validation, model output shape, and edge cases.
- AI-assisted Documentation (beginner): Docstrings or README section generated or refined with AI; documentation accurately describes function inputs, outputs, and usage.
- AI Output Validation (intermediate): Code includes explicit validation checks (e.g., data shape assertions, model coefficient bounds, missing value counts) that verify AI-generated outputs meet pipeline requirements.
- Responsible AI Usage (beginner): Commit message or code comment acknowledges a limitation of AI output (e.g., hallucinated library name, incorrect assumption about data) and describes the correction applied.
What to explain
AI assistance is allowed while building the submission. During the comprehension conversation, answer independently without AI tools, search, or outside help. Be ready to trace your actual code, explain decisions and limitations, and reason about a small change or failure case. Conceptual topics do not require a separate coded feature.
Version Control
- Repository Setup (beginner): Explain why initializing a Git repository and adding a .gitignore is the first step in a collaborative data pipeline.
- Basic Commands (beginner): Describe what information a commit message should convey and why consistent formatting helps teammates understand the pipeline evolution.
- Commits (beginner): Explain the difference between one large commit and multiple atomic commits; which approach makes it easier to identify when a bug was introduced?
- Branching (beginner): Describe the workflow: create a feature branch, make changes, then merge back to main. Why is this safer than committing directly to main?
- Merging (beginner): Explain what happens when you merge a feature branch into main and why the commit history shows both branches.
- Conflict Resolution (intermediate): Walk through a scenario where two teammates modify the same data cleaning function on different branches. How would you identify the conflict, decide which changes to keep, and complete the merge?
- Pull Requests (intermediate): Explain how a pull request with code review comments helps maintain pipeline quality and catch errors before merging to main.
SQL
- SELECT Queries (beginner): Explain what columns you selected and why; describe how WHERE conditions filter the data for quality checks.
- JOINs (intermediate): If joins are used, explain the join type (INNER or LEFT), which columns link the tables, and why that join preserves or filters rows as needed for your analysis.
- GROUP BY (intermediate): Explain which column you grouped by, which aggregate function you applied, and what business insight the grouped result provides (e.g., median house value by region).
- SELECT, FROM, WHERE (intermediate): Describe the structure of a SELECT query you wrote: what table you queried, which WHERE conditions you applied, and how they support data validation or filtering.
- GROUP BY, ORDER BY (intermediate): If ORDER BY is used with GROUP BY, explain why you sorted the grouped results and how the sort order helps interpret the summary statistics.
- Join S (INNER, LEFT) (intermediate): Explain the difference between INNER and LEFT joins; describe which join type you chose for your housing data and why it was appropriate.
- Aggregate Functions (COUNT, SUM, AVG) (intermediate): Explain which aggregate functions you used, what they computed, and how the results informed your data quality assessment or exploratory analysis.
- Subqueries (beginner): If subqueries appear in your code, explain the purpose of the inner query, how its result filters or ranks the outer query, and why a subquery was needed instead of a simple WHERE clause.
- Basic DDL/DML (beginner): Explain the table schema you created (column names, data types) and how it matches the CSV structure; describe any constraints or indexes you added for data integrity.
Programming Fundamentals
- Variables & Data Types (beginner): Explain why you chose pandas DataFrame over a plain list for storing housing records; discuss how column dtypes affect filtering and model input.
- Operators (beginner): Describe one arithmetic or comparison operator you used in your analysis; explain how it helped identify outliers or compute a summary statistic.
- Expressions (beginner): Walk through a conditional expression you wrote to detect missing or duplicate data; explain the logic and how it improved data quality.
- Control Flow (beginner): Trace through a loop or if/elif block in your cleaning code; explain the decision points and what happens to records that fail validation.
- Functions & Methods (beginner): Show a function you defined for data loading or cleaning; explain why extracting it as a function improved code readability or reusability.
- Collections (intermediate): Describe how you used a list, dictionary, or DataFrame to organize features or store validation results; explain why that collection type was appropriate for your use case.
- Exception Handling (intermediate): Identify a try/except block in your file handling or data parsing code; explain what error it catches and how your code recovers or reports the failure.
- File Handling (beginner): Explain how you read the CSV file and what you did to handle potential encoding or missing value issues; describe where you wrote output and why that format was chosen.
Python Programming
- Python Syntax (beginner): Explain how you used variable assignment, loops, or conditionals to handle missing data or filter outliers in the dataset.
- Functions (beginner): Describe why you extracted specific logic into a function and how parameters and return values make the code reusable.
- Modules & Packages (beginner): Walk through how you organized code into modules and why importing from separate files improves maintainability.
- Virtual Environments (beginner): Explain the purpose of the virtual environment and how requirements.txt ensures a teammate can reproduce your environment.
- Object-Oriented Python (intermediate): Justify the design of your class (attributes, methods, encapsulation) and how it models the housing analysis workflow; discuss how methods interact to produce the final model.
Pandas
- Series & DataFrames (beginner): Explain the difference between a Series and a DataFrame, and describe which columns in the housing dataset are Series objects and why they are useful for analysis.
- Filtering (intermediate): Walk through the filtering logic used to remove missing or duplicate records; explain why chaining conditions with & or | is necessary in Pandas and what would happen if you used and/or instead.
- GroupBy (intermediate): Describe the groupBy operation applied in the code, explain what aggregation function was chosen and why it answers a business question about housing trends, and predict how the result would change if you grouped by a different column.
Excel
- Pivot Tables (intermediate): Explain how the pivot table design (choice of row/column fields and aggregation function) supports identifying which geographic regions or age cohorts have the highest median house values, and describe one limitation of the pivot structure for this analysis.
- Lookup Functions (intermediate): Describe the lookup implementation (VLOOKUP vs. INDEX/MATCH or pandas merge strategy), explain why the chosen approach was selected over alternatives, and trace through one example row to show how a feature statistic is correctly matched and returned.
Data Cleaning & Preparation
- Missing Values (intermediate): Explain the trade-offs between removing rows with missing values versus imputation strategies (mean, median, forward-fill) for this housing dataset; justify which approach you chose and how it affects sample size and model bias.
- Outlier Detection (intermediate): Describe how you identified outliers in the housing data, why your chosen method (IQR, z-score, domain knowledge) is appropriate for real estate features, and what impact removing or retaining outliers has on the regression model and business interpretation.
Exploratory Data Analysis
- Data Profiling (intermediate): Explain how summary statistics and missing value counts inform data cleaning decisions; describe what patterns in the profiling output would trigger outlier handling or feature engineering before modeling.
- Correlation Analysis (intermediate): Interpret the correlation coefficients you computed; discuss why correlation alone is insufficient for feature selection and how you would validate that the top correlated features are appropriate for a linear regression model.
Statistical Fundamentals
- Descriptive Statistics (intermediate): Learner explains why median and interquartile range are more robust than mean and standard deviation for this housing dataset, identifies at least one feature with notable skew or outliers based on the computed statistics, and describes how these insights informed decisions about data cleaning or feature handling in the pipeline.
Data Visualization
- Power BI Fundamentals (intermediate): explain how you would choose chart types (e.g., scatter, histogram, map) to communicate housing price trends and income relationships to non-technical stakeholders; describe one filtering or drill-down interaction that supports exploratory analysis.
- Tableau Fundamentals (intermediate): walk through your approach to building a geographic visualization (latitude/longitude scatter or map) of median house values; discuss how you would use Tableau calculated fields or parameters to highlight outliers or regional clusters in the data.
Ai Assisted Software Development
- Working with AI Assistants (beginner): Explain which AI tool you used, for which pipeline task, and why you chose it over manual coding.
- Prompt Writing Fundamentals (beginner): Describe one prompt you refined and how the revision improved the AI response quality or relevance.
- Code Generation (beginner): Walk through one AI-generated function; identify what it does correctly and any assumptions it made about the housing dataset.
- AI-assisted Debugging (beginner): Describe a data quality issue the pipeline encountered and how you used AI to diagnose or fix it.
- AI-assisted Refactoring (intermediate): Explain the refactored code section, why the original was problematic, and how the AI suggestion improved readability or reduced duplication.
- AI-assisted Unit Testing (intermediate): Review one test case; explain what it validates and whether the AI-generated test logic correctly exercises the code path.
- AI-assisted Documentation (beginner): Critique the AI-generated docstring or README section; identify any inaccuracies or missing details specific to your implementation.
- AI Output Validation (intermediate): Explain the validation checks you added to the pipeline; why each check matters for catching AI errors or data anomalies.
- AI Limitations & Hallucinations (beginner): Describe one instance where AI output was incorrect or incomplete; explain how you detected it and what you corrected.
- Responsible AI Usage (beginner): Discuss one ethical or practical concern you considered when using AI for this pipeline (e.g., reproducibility, bias in generated assumptions, or attribution).
How to submit
- Before you start, register on SahkaarX and connect your GitHub account.
- When the challenge begins, SahkaarX will create a private repository under your GitHub account and notify you in the app and via push notification.
- Clone the repository, implement your pipeline, commit your work with clear messages, and push to the main branch.
- Submit your solution in the app by providing the repository URL; the system will confirm receipt.
What happens after you submit
When the challenge window closes, an automated AI review will evaluate your repository for code quality, test coverage, and correctness of outputs. You will then complete a mandatory in-app conversation to discuss your implementation, design choices, and how you handled data cleaning and modeling decisions. This conversation verifies your understanding of your own work and is required for all participants. Results are finalized after the conversation is complete.
Intellectual property
You retain full ownership of the code and analysis in your submission. SahkaarX may host, evaluate, and display your work on leaderboards and in challenge galleries. Your GitHub repository remains private under your account; you control access and can modify or delete it at any time after the challenge ends.
Skills You’ll Put to Work
Version Control
- Repository SetupBeginnerFundamental
- Basic CommandsBeginnerFundamental
- CommitsBeginnerFundamental
- BranchingBeginnerFundamental
- MergingBeginnerFundamental
- Conflict ResolutionIntermediateFundamental
- Pull RequestsIntermediateFundamental
SQL
- SELECT QueriesBeginnerFundamental
- JOINsIntermediateFundamental
- GROUP BYIntermediateFundamental
- SELECT, FROM, WHEREIntermediateFundamental
- GROUP BY, ORDER BYIntermediateFundamental
- Join S (INNER, LEFT)IntermediateFundamental
- Aggregate Functions (COUNT, SUM, AVG)IntermediateFundamental
- SubqueriesBeginnerFundamental
- Basic DDL/DMLBeginnerFundamental
Programming Fundamentals
- Variables & Data TypesBeginnerFundamental
- OperatorsBeginnerFundamental
- ExpressionsBeginnerFundamental
- Control FlowBeginnerFundamental
- Functions & MethodsBeginnerFundamental
- CollectionsIntermediateFundamental
- Exception HandlingIntermediateFundamental
- File HandlingBeginnerFundamental
Python Programming
- Python SyntaxBeginnerFundamental
- FunctionsBeginnerFundamental
- Modules & PackagesBeginnerFundamental
- Virtual EnvironmentsBeginnerFundamental
- Object-Oriented PythonIntermediateFundamental
Pandas
- Series & DataFramesBeginnerFundamental
- FilteringIntermediateFundamental
- GroupByIntermediateFundamental
Excel
- Pivot TablesIntermediateFundamental
- Lookup FunctionsIntermediateFundamental
Data Cleaning & Preparation
- Missing ValuesIntermediateFundamental
- Outlier DetectionIntermediateFundamental
Exploratory Data Analysis
- Data ProfilingIntermediateFundamental
- Correlation AnalysisIntermediateFundamental
Statistical Fundamentals
- Descriptive StatisticsIntermediateFundamental
Data Visualization
- Power BI FundamentalsIntermediateFundamental
- Tableau FundamentalsIntermediateFundamental
Ai Assisted Software Development
- Working with AI AssistantsBeginnerFundamental
- Prompt Writing FundamentalsBeginnerFundamental
- Code GenerationBeginnerFundamental
- AI-assisted DebuggingBeginnerFundamental
- AI-assisted RefactoringIntermediateFundamental
- AI-assisted Unit TestingIntermediateFundamental
- AI-assisted DocumentationBeginnerFundamental
- AI Output ValidationIntermediateFundamental
- AI Limitations & HallucinationsBeginnerFundamental
- Responsible AI UsageBeginnerFundamental
Before You Register
- Prerequisites: review the target audience, skills covered, and challenge brief.
- Deadlines: check the key dates and complete required submissions before the challenge deadline.
- Participation: Solo only.
- Evaluation: review the brief and FAQs for scoring criteria and how your work will be assessed.
- AI assistance: check this challenge's rules before using AI tools. If the rules are unclear, ask support before submitting.
Questions? Contact SahkaarX support.
Intellectual property: participants retain
Frequently Asked Questions
Who can join this challenge?
This is an open challenge for entry-level data analysts. Solo participants are welcome; teams are not allowed.
Do I need to create my own GitHub repository?
No. SahkaarX will create a private repository for you when the challenge starts. Simply clone it, implement your solution, and push your commits.
When does evaluation happen?
Automated evaluation runs after the challenge window closes, not immediately after you submit. You will then participate in a mandatory in-app conversation to discuss your work.
What is the mandatory conversation?
After submission, you will have a structured conversation in the app to explain your data cleaning approach, EDA findings, and model design. This verifies you understand your own code and is required for all participants.
Skill feedback helps you decide what to practise next. Learning plans follow eligible evaluated results; additional plans are paid. No job guarantee.