
Completed
Iris Flower Data Analysis Pipeline - Week of 26 Oct 2026
This challenge has ended. You can still review the details below.
Explore the latest challenge for this roleBuild a Python data analysis pipeline using Pandas, SQL, and visualization to explore and clean the Iris dataset, then export results to Excel. Your work will be evaluated through repository artifacts and a mandatory comprehension conversation.
Data Analyst
Solo only.
Share this challenge
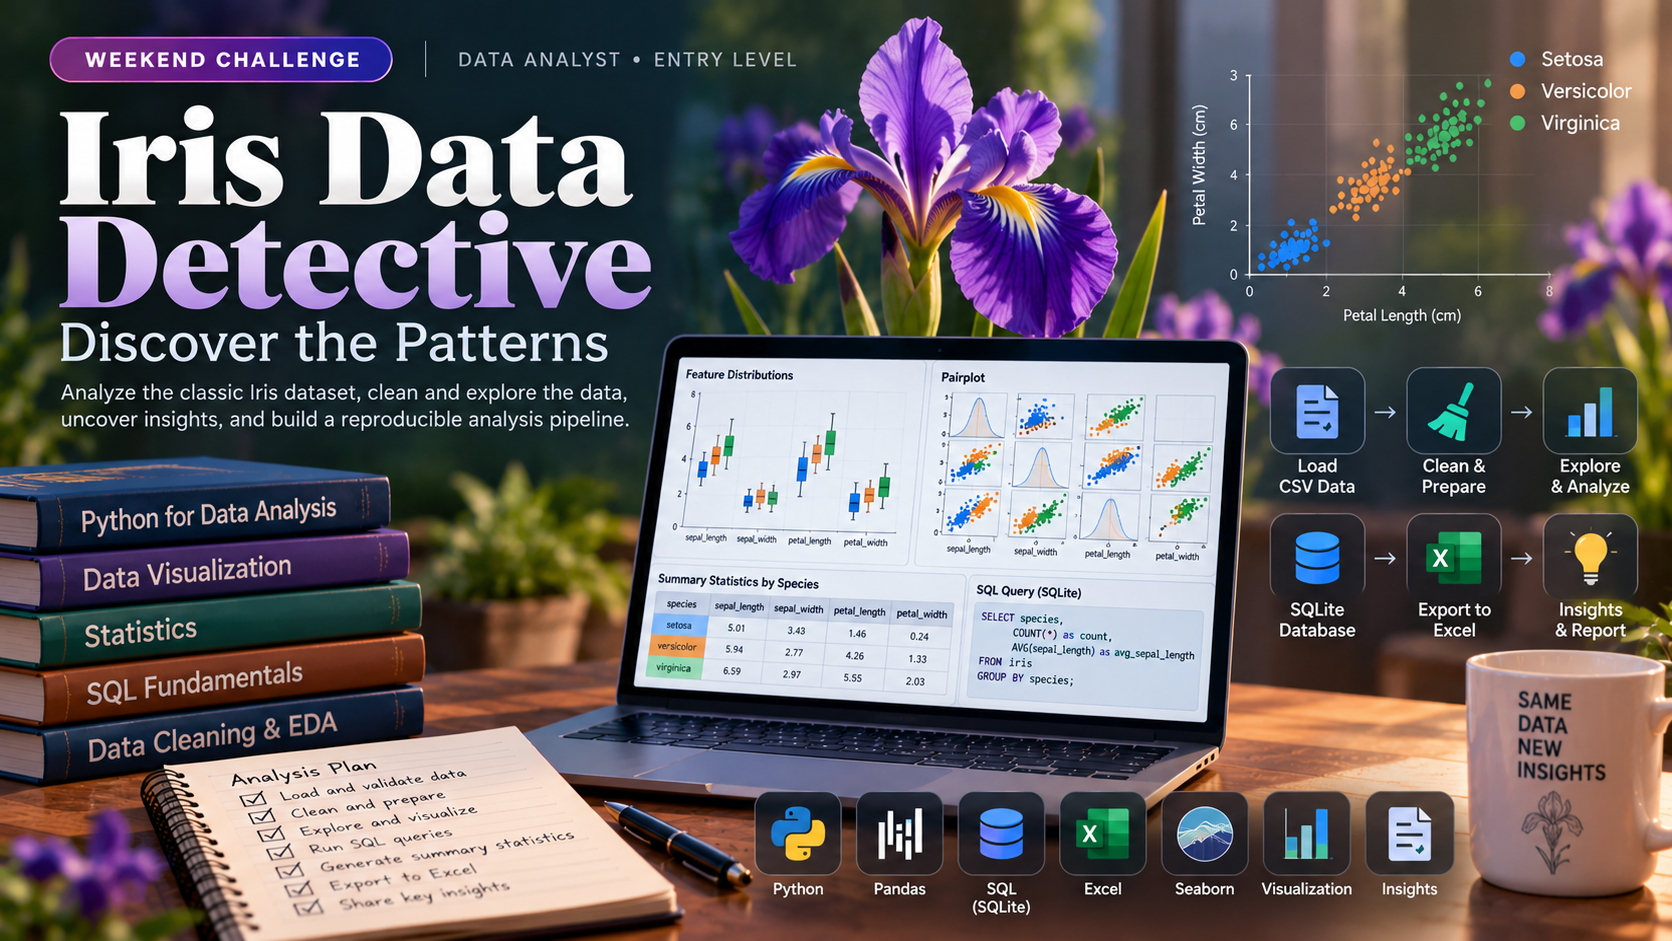
The Challenge Brief
Problem definition
Input data (download): https://raw.githubusercontent.com/mwaskom/seaborn-data/master/iris.csv
The Iris dataset contains 150 flower measurements across four numeric columns (sepal_length, sepal_width, petal_length, petal_width) and one categorical column (species). You must load this CSV, perform exploratory data analysis, clean any anomalies, compute summary statistics, and visualize distributions and relationships. The pipeline must store cleaned data in a local SQLite database, query it to generate a summary report, and export results to Excel. Every line under Success criteria is in scope for this challenge. Build the core scope in Task brief. Topic coverage uses repository evidence where available and the comprehension conversation; it does not require a separate feature for every topic.
Task brief
You will build a complete data analysis workflow demonstrating Version Control, SQL, Programming Fundamentals, Python Programming, Pandas, Excel, Data Cleaning & Preparation, Exploratory Data Analysis, Statistical Fundamentals, Data Visualization, and AI Assisted Software Development. Implement a Python script that: (1) loads and validates the Iris CSV; (2) detects and handles missing or duplicate rows; (3) computes descriptive statistics grouped by species; (4) creates a SQLite database and populates it with cleaned data; (5) queries the database to generate a summary report; (6) produces at least two publication-ready visualizations (e.g., scatter plot, box plot, histogram); (7) exports the cleaned dataset and summary statistics to Excel. Use pytest to validate data integrity at each step. Commit your work to version control with clear commit messages. Expected effort: 6-8 hours of focused implementation with AI assistance.
Version Control
Initialize and maintain a Git repository for the Iris data pipeline, committing code changes at logical checkpoints as you load, clean, analyze, and export data. Use branches to isolate experimental work and merge changes back to main, resolving any conflicts that arise. Version Control ensures the team can track changes, reproduce results, and collaborate on the analysis reproducibly.
SQL
SQL is the core skill for storing, querying, and summarizing the cleaned Iris dataset in a local SQLite database. You will write SQL queries to load measurements into tables, filter and aggregate data by species, and extract summary statistics for the Excel report. This skill ensures the pipeline is reproducible and testable across the team.
Programming Fundamentals
Programming Fundamentals underpins the entire Iris data pipeline: you will write Python scripts that load CSV data, declare variables to store measurements and species names, apply operators and expressions to filter and transform data, use control flow to iterate over records and handle edge cases, define functions to encapsulate cleaning and analysis logic, organize data in collections (lists and dictionaries), handle file I/O and exceptions when reading from the remote CSV and writing to SQLite, and structure the code for reproducibility and testing. This skill ensures your pipeline is readable, maintainable, and executable by teammates.
Python Programming
Build a reproducible Python data pipeline to load the Iris CSV, perform exploratory data analysis, clean anomalies, compute summary statistics, and visualize distributions and relationships. Store the cleaned dataset in SQLite, query it to generate a summary report, and export results to Excel. Python Programming underpins the entire pipeline: you will write functions and modules to orchestrate data loading, transformation, and export; organize code in a virtual environment; and apply object-oriented design where appropriate to make the pipeline testable and maintainable.
Pandas
Use Pandas to load the Iris CSV, construct Series and DataFrames to explore the dataset structure, filter rows by species and numeric thresholds to identify data quality issues, and apply GroupBy aggregations to compute summary statistics by species for storage in SQLite and export to Excel.
Excel
Export cleaned Iris summary statistics and grouped analysis to Excel using pivot tables and lookup functions. After the Python pipeline loads, cleans, and queries the SQLite database, use Excel to organize species-level summaries and cross-reference measurement ranges, ensuring stakeholders receive a professional, formula-driven report.
Data Cleaning & Preparation
As a junior data analyst, you will perform Data Cleaning & Preparation on the Iris dataset by loading the CSV, identifying and handling missing values and outliers, and storing the cleaned data in SQLite. This step ensures data quality before exploratory analysis, summary statistics, and visualization for stakeholder reporting.
Exploratory Data Analysis
Perform exploratory data analysis on the Iris dataset by loading the CSV, computing summary statistics, identifying and handling anomalies, and visualizing distributions and relationships between numeric features and species. This skill underpins the data cleaning and reporting pipeline by establishing data quality and revealing patterns that inform downstream database storage and stakeholder communication.
Statistical Fundamentals
Apply Descriptive Statistics to the Iris dataset by computing and interpreting summary statistics (mean, median, standard deviation, quartiles) for each numeric feature and species group. Load the CSV, calculate these measures in Python, store results in SQLite, and export them to Excel so stakeholders can understand the central tendency, spread, and distribution shape of flower measurements.
Data Visualization
As a junior data analyst, you will create visualizations of the Iris dataset to explore distributions and relationships between flower measurements and species. Data Visualization is the core skill: you will use Python plotting libraries to generate charts that highlight differences across species and communicate findings to stakeholders. Embed these visualizations in your analysis pipeline alongside cleaned data storage and summary statistics.
Ai Assisted Software Development
Use AI assistants to accelerate development of the Iris data pipeline: generate Python code for CSV loading, EDA, SQLite storage, and Excel export; validate and refactor AI-generated code; write unit tests with AI support; and document the pipeline. Apply prompt engineering, code generation, debugging, and output validation throughout the core workflow to build a reproducible, testable analysis system.
Language and stack
Python 3, Pandas, SQLite3, Matplotlib or Seaborn, openpyxl or xlsxwriter, pytest, Git.
Scenario
You are a junior data analyst at a botanical research firm. The team has collected Iris flower measurements and needs a reproducible pipeline to clean, explore, and report on the data before sharing findings with stakeholders. Your manager expects a clean dataset in the database, summary statistics in Excel, and clear visualizations that highlight differences between species. The analysis must be version-controlled and testable so other team members can run it independently.
Deliverables
- Python script(s) that load, clean, analyze, and visualize the Iris data; includes pytest tests validating data quality at each stage.
- SQLite database containing the cleaned Iris dataset and a summary statistics table.
- Excel workbook with cleaned data and summary statistics (one sheet per output type).
Success criteria
These are repository evidence checks within the core scope, not additional feature requests. One implementation or test may provide evidence for several topics. Missing implementation evidence remains unverified; explanations alone do not demonstrate implementation proficiency.
Version Control
- Repository Setup (beginner): Git repository initialized in the project root with a .gitignore file excluding pycache, *.pyc, .pytest_cache, and local database files.
- Basic Commands (beginner): At least three commits present in the repository history, each with a clear message describing a logical step (e.g., load data, clean anomalies, compute statistics).
- Commits (beginner): Commits are atomic and focused; each commit message describes what changed and why (e.g., "Remove null values from sepal_width column").
- Branching (beginner): At least one feature branch created, used to develop a specific part of the pipeline (e.g., data-cleaning or visualization), and merged back to main.
- Merging (beginner): Feature branch successfully merged into main without manual conflict resolution required, or merge completed with conflicts resolved correctly.
- Conflict Resolution (intermediate): If a merge conflict occurs (e.g., two branches modify the same data-cleaning function), the conflict markers are resolved, the correct logic is retained, and the merge is completed with a clear commit message.
- Pull Requests (intermediate): If using a remote repository, a pull request created for a feature branch, reviewed for code quality, and merged with a descriptive message; or if local-only, evidence of branch review reasoning before merge.
SQL
- SELECT Queries (beginner): Repository contains a working SELECT query that retrieves all or filtered rows from the iris table; inspect the query in the database module or test file.
- JOINs (intermediate): inspect relevant code or tests within the core scope if present; do not add a feature solely for this topic. Missing implementation evidence remains unverified.
- GROUP BY (intermediate): Repository contains a GROUP BY query that aggregates measurements (e.g., COUNT, AVG) by species; verify the query executes and produces correct grouped output.
- SELECT, FROM, WHERE (intermediate): Repository contains queries using SELECT with FROM and WHERE clauses to filter measurements by species or numeric thresholds; verify queries execute and return correct subsets.
- GROUP BY, ORDER BY (intermediate): Repository contains queries using GROUP BY with ORDER BY to sort aggregated results (e.g., species by average sepal length); inspect query output in database module or test.
- Join S (INNER, LEFT) (intermediate): If the schema includes a separate species or measurement table, inspect a working INNER or LEFT JOIN query that combines data; assess only if present in the core schema.
- Aggregate Functions (COUNT, SUM, AVG) (intermediate): Repository contains queries using COUNT, SUM, or AVG to compute summary statistics per species or overall; inspect query results in the database module or test output.
- Subqueries (beginner): If repository contains a subquery (e.g., filtering by average petal length computed in a nested SELECT), inspect the query logic and verify correct results; assess only if present.
- Basic DDL/DML (beginner): Repository contains CREATE TABLE and INSERT statements to initialize the iris table and load CSV data; verify schema and row count in database module or test.
Programming Fundamentals
- Variables & Data Types (beginner): Repository contains assignments of numeric (float/int) and string variables representing sepal/petal measurements and species names; inspect type consistency in at least one function or script section.
- Operators (beginner): Code demonstrates arithmetic operators (e.g., computing mean or scaling values) and comparison operators (e.g., filtering by species or threshold) in at least one analysis step.
- Expressions (beginner): Conditional or arithmetic expressions appear in filtering logic, summary statistic computation, or data validation; verify correctness by tracing one expression with sample data.
- Control Flow (beginner): For-loops or while-loops iterate over rows or records; if-statements validate data or branch on species type; evidence must be present in the core pipeline code.
- Functions & Methods (beginner): At least two user-defined functions encapsulate distinct tasks (e.g., load_data, clean_data, compute_stats); each function has a clear input and output.
- Collections (intermediate): Lists or dictionaries store multiple measurements, species labels, or summary results; demonstrate indexing, iteration, or aggregation of at least one collection in the pipeline.
- Exception Handling (intermediate): Try-except blocks catch file-not-found, CSV parsing errors, or database errors; at least one exception handler is present and functional in the core code.
- File Handling (beginner): Code opens, reads the remote CSV file, and writes cleaned data to SQLite or Excel; file operations are explicit and error-checked if exception handling is present.
Python Programming
- Python Syntax (beginner): Code loads CSV, performs basic data operations (filtering, grouping, aggregation), and executes without syntax errors; inspect the main script or notebook for correct variable assignment, list/dict usage, and control flow.
- Functions (beginner): At least one reusable function is defined and called to perform a discrete task (e.g., load_data, clean_anomalies, compute_stats); verify function definition, parameters, and return values in the core pipeline.
- Modules & Packages (beginner): Code imports and uses standard libraries (pandas, sqlite3, openpyxl or xlsxwriter) and at least one custom module or script file; inspect import statements and module organization in the repository.
- Virtual Environments (beginner): A requirements.txt or pyproject.toml file is present listing dependencies; verify the file exists and contains pandas, sqlite3 (or equivalent), and visualization libraries.
- Object-Oriented Python (intermediate): At least one class is defined (e.g., IrisAnalyzer or DataPipeline) with methods for loading, cleaning, querying, and exporting; verify class definition, method signatures, and instantiation in the main workflow.
Pandas
- Series & DataFrames (beginner): Load iris.csv into a DataFrame; inspect shape, dtypes, and head() output in the repository code or test assertions.
- Filtering (intermediate): Filter DataFrame rows by species name and numeric column conditions (e.g., sepal_length > threshold); verify filtered results are used in downstream cleaning or summary logic.
- GroupBy (intermediate): Apply groupby("species") to compute mean, std, or count aggregations; confirm grouped results are persisted to database or exported to Excel.
Excel
- Pivot Tables (intermediate): Excel workbook contains at least one pivot table that groups measurements by species and computes aggregate statistics (mean, count, or range); verify the pivot table is present in the exported file and correctly summarizes the cleaned data.
- Lookup Functions (intermediate): Excel workbook includes at least one VLOOKUP, INDEX/MATCH, or equivalent function that retrieves or cross-references values (e.g., species name, measurement threshold, or summary statistic) from a reference table or data range; confirm the formula is functional and returns correct values.
Data Cleaning & Preparation
- Missing Values (intermediate): Code detects and handles missing values in the loaded Iris dataset (e.g., using pandas isnull(), fillna(), or dropna()); evidence visible in the data cleaning module or test assertions confirming no NaN values remain in the SQLite table.
- Outlier Detection (intermediate): Code applies an outlier detection method (e.g., IQR, z-score, or isolation forest) to numeric columns; evidence visible in the cleaning pipeline, with flagged or removed outliers logged or stored in the database for traceability.
Exploratory Data Analysis
- Data Profiling (intermediate): Load iris.csv and generate summary statistics (mean, median, std, min, max, count, missing values) for each numeric column; verify output shows all four numeric features and detects any null or anomalous values in the dataset.
- Correlation Analysis (intermediate): Compute pairwise correlations between sepal_length, sepal_width, petal_length, and petal_width; produce a correlation matrix or heatmap visualization that is stored or exported as part of the analysis output.
Statistical Fundamentals
- Descriptive Statistics (intermediate): Code computes mean, median, standard deviation, and quartile values for sepal_length, sepal_width, petal_length, and petal_width; results are grouped by species and stored in the SQLite database; Excel export includes these summary statistics in a readable table format.
Data Visualization
- Power BI Fundamentals (intermediate): If Power BI artifacts are present in the repository (e.g., .pbix file or exported Power BI report), verify that at least two visualizations (e.g., scatter plot of petal_length vs petal_width, bar chart of species counts) are correctly configured with appropriate axes, legends, and filters; assess only if present in core scope.
- Tableau Fundamentals (intermediate): If Tableau workbooks or exported Tableau visualizations are present in the repository, verify that at least two interactive dashboards or sheets display Iris data with correct dimension and measure mappings (e.g., species as dimension, sepal_length as measure) and at least one filter or parameter; assess only if present in core scope.
Ai Assisted Software Development
- Working with AI Assistants (beginner): Repository contains evidence of AI tool usage (e.g., commit messages, code comments, or tool-generated artifacts) in at least two distinct pipeline stages (load, clean, analyze, store, export).
- Prompt Writing Fundamentals (beginner): At least one commit or code comment demonstrates a specific, structured prompt that requests a concrete deliverable (e.g., function signature, error handling requirement, or test case).
- Code Generation (beginner): AI-generated Python functions for CSV loading, data cleaning, or summary statistics are present in the repository and execute without syntax errors.
- AI-assisted Debugging (beginner): Repository contains evidence of a bug fix or error correction (commit message, code comment, or test update) that references AI assistance or shows iterative refinement.
- AI-assisted Refactoring (intermediate): Refactored code segment (e.g., function consolidation, loop optimization, or improved readability) is committed with explanation of the change; code executes and passes existing tests.
- AI-assisted Unit Testing (intermediate): pytest test file includes at least three test cases generated or refined with AI assistance; tests execute and pass; test file or commit message indicates AI involvement.
- AI-assisted Documentation (beginner): Docstrings, README section, or inline comments are present and explain at least one pipeline function; documentation is accurate relative to the code behavior.
- AI Output Validation (intermediate): Code review evidence (commit message, comment, or test) shows the learner identified and corrected an AI error, hallucination, or incomplete output before merging.
- Responsible AI Usage (beginner): At least one commit message or documentation note acknowledges a limitation of AI output, a manual verification step, or a decision to override AI suggestion.
What to explain
AI assistance is allowed while building the submission. During the comprehension conversation, answer independently without AI tools, search, or outside help. Be ready to trace your actual code, explain decisions and limitations, and reason about a small change or failure case. Conceptual topics do not require a separate coded feature.
Version Control
- Repository Setup (beginner): Explain why .gitignore is necessary and what files should be excluded from version control in a data analysis project.
- Basic Commands (beginner): Describe the purpose of git add, git commit, and git log, and how they work together to track changes.
- Commits (beginner): Explain what makes a good commit message and why atomic commits are better than large, multi-topic commits.
- Branching (beginner): Describe when and why you created a feature branch, and how branching isolates your work from the main pipeline.
- Merging (beginner): Explain the merge process and what happens when Git combines two branches with no conflicts.
- Conflict Resolution (intermediate): Walk through a merge conflict scenario: what caused it, how you identified the conflict markers, and how you decided which version to keep or how you combined both changes.
- Pull Requests (intermediate): Explain the purpose of a pull request in a team setting, what code review should check for, and how it improves code quality before merging to main.
SQL
- SELECT Queries (beginner): Explain what a SELECT query retrieves and why column names or wildcards are used to specify output.
- JOINs (intermediate): explain a concrete behavior, constraint, or tradeoff; where code exists, trace it and predict a small change or failure case. Explanation alone does not establish implementation proficiency.
- GROUP BY (intermediate): Explain how GROUP BY partitions rows by a column (e.g., species) and why aggregate functions are required in the SELECT list; describe the difference between filtering rows (WHERE) and filtering groups (HAVING).
- SELECT, FROM, WHERE (beginner): Explain the role of FROM to identify the table and WHERE to filter rows; describe how to combine multiple conditions with AND/OR.
- GROUP BY, ORDER BY (intermediate): Explain how ORDER BY sorts grouped results and the syntax for ascending vs. descending order; predict the output of a query combining GROUP BY, aggregate functions, and ORDER BY.
- Join S (INNER, LEFT) (intermediate): Explain the difference between INNER JOIN (matching rows only) and LEFT JOIN (all left rows plus matches); predict the row count and columns in a join result given two tables and a join condition.
- Aggregate Functions (COUNT, SUM, AVG) (intermediate): Explain what each function computes (row count, total, mean) and how NULL values are handled; describe when to use COUNT(*) vs. COUNT(column).
- Subqueries (beginner): Explain how a subquery (nested SELECT) computes an intermediate result used in the outer query; describe one scenario where a subquery is simpler than a JOIN.
- Basic DDL/DML (beginner): Explain the purpose of CREATE TABLE (define schema) and INSERT (add rows); describe how data types (INTEGER, REAL, TEXT) map to CSV columns.
Programming Fundamentals
- Variables & Data Types (beginner): Explain why you chose float for sepal measurements and string for species; describe what would happen if you stored measurements as strings instead.
- Operators (beginner): Walk through one arithmetic or comparison expression in your code; predict the result for a specific input (e.g., a measurement value or species name).
- Expressions (beginner): Describe the logic of one conditional expression in your filtering or validation code; explain when it evaluates to true or false.
- Control Flow (beginner): Trace through a for-loop or if-statement in your pipeline with a sample row; explain how the loop or branch handles different species or edge cases.
- Functions & Methods (beginner): Explain the purpose of one user-defined function, its parameters, and its return value; describe how it is called elsewhere in the pipeline.
- Collections (intermediate): Describe how you use a list or dictionary to store or retrieve data; explain why you chose that collection type over another (e.g., list vs. tuple, dict vs. list).
- Exception Handling (intermediate): Identify one exception your code catches; explain what error condition triggers it and how your handler responds (e.g., logging, default value, or re-raise).
- File Handling (beginner): Explain how your code opens the CSV file and handles the case where the file is missing or malformed; describe the steps your code takes to ensure data is read correctly.
Python Programming
- Python Syntax (beginner): Explain how you chose variable names and control structures (if/for/while) to make the data pipeline readable; describe one syntax choice you made and why it fits the task.
- Functions (beginner): Describe the purpose of one function you wrote, what parameters it accepts, and what it returns; explain why breaking this logic into a function improves the pipeline.
- Modules & Packages (beginner): Name two libraries you imported and explain what each one does in your pipeline; if you created a custom module, describe what it contains and how it is imported.
- Virtual Environments (beginner): Explain what a virtual environment is and why it matters for reproducibility; describe how you created or would create one for this project.
- Object-Oriented Python (intermediate): Describe the class you designed: what attributes does it hold (e.g., dataframe, database connection), what methods does it provide, and how does organizing code this way make the pipeline easier to test and reuse?
Pandas
- Series & DataFrames (beginner): Explain the difference between a Series and a DataFrame and why a DataFrame is appropriate for multi-column tabular data like Iris.
- Filtering (intermediate): Describe how boolean indexing or .loc[] filters rows; trace through a filtering operation and predict the resulting row count or values.
- GroupBy (intermediate): Explain how groupby() partitions data by species and why aggregation functions (mean, std) are applied per group; critique or improve a groupby chain for correctness and readability.
Excel
- Pivot Tables (intermediate): Explain how the pivot table structure (rows, columns, values) was chosen to highlight differences between species and why that layout serves the stakeholder report better than a flat table.
- Lookup Functions (intermediate): Describe the lookup formula logic: what data it retrieves, why that reference structure was selected, and how it would behave if a lookup value were missing or duplicated.
Data Cleaning & Preparation
- Missing Values (intermediate): Explain the trade-offs between removing rows with missing values versus imputation; justify the chosen strategy for the Iris dataset and describe how it affects downstream analysis.
- Outlier Detection (intermediate): Describe the outlier detection method used, why it was chosen over alternatives, and how you decided whether to remove, flag, or retain outliers in the cleaned dataset.
Exploratory Data Analysis
- Data Profiling (intermediate): Explain how summary statistics reveal data quality issues (e.g., outliers, missing values, scale differences) and why profiling is necessary before storing data in the database; reference specific statistics from the Iris dataset analysis.
- Correlation Analysis (intermediate): Describe which feature pairs show strong correlation in the Iris data, interpret what those relationships suggest about flower morphology, and discuss how correlation findings influence feature selection or data interpretation for the stakeholder report.
Statistical Fundamentals
- Descriptive Statistics (intermediate): Explain why median and mean differ for at least one feature, what standard deviation reveals about measurement variability across species, and how quartiles help identify outliers or skew in the Iris data; demonstrate understanding by predicting which species likely has the largest petal_length spread based on summary statistics reasoning.
Data Visualization
- Power BI Fundamentals (intermediate): Explain how you would configure a Power BI visual to compare petal measurements across species, including choice of chart type, field placement, and any filters or slicers you would add to support stakeholder exploration.
- Tableau Fundamentals (intermediate): Describe how you would build a Tableau dashboard to show the relationship between sepal and petal dimensions, including which dimensions and measures you would use, what chart types you would choose, and how interactivity (e.g., filters, drill-down) would help stakeholders understand species differences.
Ai Assisted Software Development
- Working with AI Assistants (beginner): Explain which AI tool you used, what task you assigned to it, and how you integrated its output into your pipeline.
- Prompt Writing Fundamentals (beginner): Describe one prompt you wrote: what problem it solved, how you structured it (e.g., context, constraints, format), and whether the output met your expectation on the first attempt.
- Code Generation (beginner): Show one AI-generated function and explain what you asked for, whether the output was correct, and what you changed (if anything).
- AI-assisted Debugging (beginner): Describe a bug or error you encountered, how you used AI to diagnose or fix it, and whether the AI suggestion was accurate.
- AI-assisted Refactoring (intermediate): Explain the refactoring change: what problem it addressed, how AI suggested the improvement, and how you verified the refactored code was correct and equivalent.
- AI-assisted Unit Testing (intermediate): Show one test case and explain how AI helped generate or improve it; discuss whether the test is meaningful and covers the intended behavior.
- AI-assisted Documentation (beginner): Explain how you used AI to draft or improve documentation; assess whether the result is clear and accurate for a team member reading it.
- AI Output Validation (intermediate): Explain your process for checking AI-generated code before use; give one example of a validation step that caught an error or gap.
- AI Limitations & Hallucinations (beginner): Describe one instance where AI output was incomplete, incorrect, or misleading; explain how you detected it and what you did.
- Responsible AI Usage (beginner): Discuss one decision you made about when to use or not use AI in this project; explain your reasoning (e.g., code clarity, security, accuracy, team review).
How to submit
- Before you start, register on the SahkaarX platform and connect your GitHub account.
- When the challenge begins, SahkaarX will create a private GitHub repository and notify you in the app and via push notification; clone that repository to your local machine.
- Implement your analysis pipeline in the cloned repository, commit your work with clear messages, and push to the remote repository.
- Submit your solution in the app using the system-created repository link; do not create your own GitHub repository.
What happens after you submit
When the challenge window closes, an automated AI-powered review will evaluate your repository for code quality, test coverage, and data integrity. You will then complete a mandatory in-app conversation where you explain your implementation choices, how you handled data cleaning, and what insights your visualizations reveal. This conversation verifies your understanding of your own work and is required for all participants. If human judges are assigned, they will review the AI scores and your conversation transcript before final results are published.
Intellectual property
You retain full ownership of the code and analysis in your submission. SahkaarX may host, evaluate, and display your work on leaderboards and in the platform. Your GitHub repository remains private under your account; you control access and can reuse the code for your portfolio or future projects.
Skills You’ll Put to Work
Version Control
- Repository SetupBeginnerFundamental
- Basic CommandsBeginnerFundamental
- CommitsBeginnerFundamental
- BranchingBeginnerFundamental
- MergingBeginnerFundamental
- Conflict ResolutionIntermediateFundamental
- Pull RequestsIntermediateFundamental
SQL
- SELECT QueriesBeginnerFundamental
- JOINsIntermediateFundamental
- GROUP BYIntermediateFundamental
- SELECT, FROM, WHEREIntermediateFundamental
- GROUP BY, ORDER BYIntermediateFundamental
- Join S (INNER, LEFT)IntermediateFundamental
- Aggregate Functions (COUNT, SUM, AVG)IntermediateFundamental
- SubqueriesBeginnerFundamental
- Basic DDL/DMLBeginnerFundamental
Programming Fundamentals
- Variables & Data TypesBeginnerFundamental
- OperatorsBeginnerFundamental
- ExpressionsBeginnerFundamental
- Control FlowBeginnerFundamental
- Functions & MethodsBeginnerFundamental
- CollectionsIntermediateFundamental
- Exception HandlingIntermediateFundamental
- File HandlingBeginnerFundamental
Python Programming
- Python SyntaxBeginnerFundamental
- FunctionsBeginnerFundamental
- Modules & PackagesBeginnerFundamental
- Virtual EnvironmentsBeginnerFundamental
- Object-Oriented PythonIntermediateFundamental
Pandas
- Series & DataFramesBeginnerFundamental
- FilteringIntermediateFundamental
- GroupByIntermediateFundamental
Excel
- Pivot TablesIntermediateFundamental
- Lookup FunctionsIntermediateFundamental
Data Cleaning & Preparation
- Missing ValuesIntermediateFundamental
- Outlier DetectionIntermediateFundamental
Exploratory Data Analysis
- Data ProfilingIntermediateFundamental
- Correlation AnalysisIntermediateFundamental
Statistical Fundamentals
- Descriptive StatisticsIntermediateFundamental
Data Visualization
- Power BI FundamentalsIntermediateFundamental
- Tableau FundamentalsIntermediateFundamental
Ai Assisted Software Development
- Working with AI AssistantsBeginnerFundamental
- Prompt Writing FundamentalsBeginnerFundamental
- Code GenerationBeginnerFundamental
- AI-assisted DebuggingBeginnerFundamental
- AI-assisted RefactoringIntermediateFundamental
- AI-assisted Unit TestingIntermediateFundamental
- AI-assisted DocumentationBeginnerFundamental
- AI Output ValidationIntermediateFundamental
- AI Limitations & HallucinationsBeginnerFundamental
- Responsible AI UsageBeginnerFundamental
Before You Register
- Prerequisites: review the target audience, skills covered, and challenge brief.
- Deadlines: check the key dates and complete required submissions before the challenge deadline.
- Participation: Solo only.
- Evaluation: review the brief and FAQs for scoring criteria and how your work will be assessed.
- AI assistance: check this challenge's rules before using AI tools. If the rules are unclear, ask support before submitting.
Questions? Contact SahkaarX support.
Intellectual property: participants retain
Skill feedback helps you decide what to practise next. Learning plans follow eligible evaluated results; additional plans are paid. No job guarantee.